The Crypto Ecosystem
It is not only volatility that gives an indication of the structure of the crypto market. There are other factors, absolutely relevant and very often placed in the background, that deserve proper attention.
Chainanalysis, a blockchain data platform, has carried out research with the aim of highlighting these factors. There is an alternative point of view towards the crypto market according to which trends can be examined independently of rises and falls of prices. The interest of this research was to capture the outlook for the crypto market after the blow suffered in mid-2022 when prices collapsed and still have not recovered.
In 2022 Bitcoin fell by about 70 per cent from its peak value of $69,000 in November 2021 and most other altcoins fell by about 80-90 per cent. The collapse of cryptocurrencies in 2022 was mainly caused by the Federal Reserve’s interest rate hike, thus stemming from a global macroeconomic issue. In fact, generally as interest rates rise, investors move away from risky assets and put their money into safer assets. Investors are wondering whether this event has led to a definitive change or whether it is a systemic event that is part of much more complex and articulated mechanisms.
Generally, according to Chainanalysis’ research, a continuity with the ecosystem of a year ago can be seen in the crypto market rather than a definitive break. It is true that the prices of cryptocurrencies dropped dramatically in 2022, but this is not the first time such events have occurred. This kind of instability seems to be a systematic constant in the crypto market. Here is a timeline of Bitcoin’s last major crashes.
| YEAR | DROP | BTC PRICE CHANGE | CAUSE |
|---|---|---|---|
| June 2011 | -99% | $32 to $0.01 | Mt Gox exchange hack |
| August 2012 | -56% | $15.25 to 7.50% | Shutdown of Ponzi scheme that stole 700K BTC |
| April 2013 | -83% | $260 to $50 | Mt Gox shutdown |
| December 2018 | -84% | $20K to $12K | BTC bubble burst & hacks (Korea & Japan) |
| March 2020 | -50% | $10K to $4K | Covid19 and global economic standstill |
| May 2021 | -53% | $58K to $36K | China crypto crackdown & Tesla |
Source: Phemex
The Three Parameters Involved
Liquidity
It is important to recognise the distinction between liquid and illiquid portfolios, as they move differently in the market.
Chainanalysis considers a portfolio to be liquid if it sends an amount of value equal to or greater than 25 per cent of the total value of the transaction, so rather than just receiving funds, a substantial amount of value is sent. In contrast, illiquid portfolios are those that receive money and do not send funds.
Holding behavior
Another aspect to be taken into account is the length of the waiting periods for investors. Very often in the crypto market, a lot of attention is given to short investors, as it is a very volatile market with very frequent rises and falls. In reality a large part of the bitcoin supply is held by long investors who hold portfolios that are not traded for 9 or 10 years.
Wealth distribution
The scale of individual investors also matters a great deal. There are ‘whale’ investors who hold millions just as there are investors who move some assets in the market in a cautious and experimental manner. In the crypto market, a small percentage of portfolios hold a large percentage of the wealth.

Chainanalysis Research
With regard to the three parameters taken into consideration, Chainanalysis’ research showed that within the crypto market, continuity with past periods can be seen.
- Liquidity has remained stable, as the percentage of illiquid portfolios in the market has increased only slightly.
- Most long-term holders did not sell their holdings. The losses were mainly suffered by speculative investors, who precisely abandoned the market, but the hodlers did not have a negative balance since the long term is taken into account.
- Since the crypto market is top heavy, the distribution of wealth has not changed significantly. A top heavy market is one in which a small percentage of portfolios hold most of the wealth.
Ethereum and Bitcoin are largely held by long-term services. In fact, about 3% of their supply resides in wallets less than two weeks old and about 10% in wallets between two weeks and three months old.
It is noticeable that the percentage of Bitcoin and Ethereum supply that resides in wallets between 1 and 5 years old is very high (30-40%).
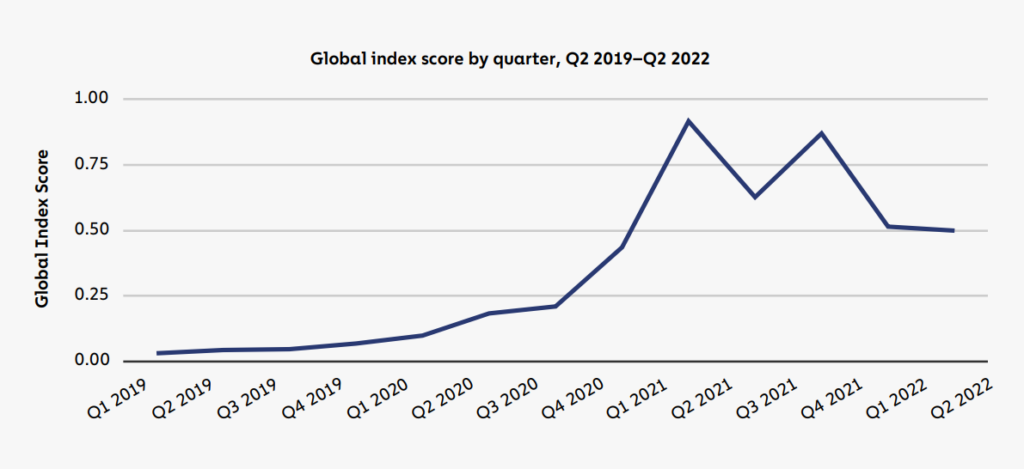
The graph of the global index score by quarter, which shows the period between the second quarter of 2019 and the second quarter of 2022, shows that global adoption today is still at significantly higher levels than it was during the upswing in 2019.
The 2022 Global Crypto Adoption Index Top 20
| Country | Overall index ranking | Centralized service value received ranking | Retail centralized service value received ranking | P2P exchange trade volume raking | DeFi value received ranking | Retail DeFi value received ranking |
|---|---|---|---|---|---|---|
| Vietnam | 1 | 5 | 5 | 2 | 7 | 6 |
| Philippines | 2 | 4 | 4 | 66 | 13 | 5 |
| Ukraine | 3 | 6 | 6 | 39 | 10 | 14 |
| India | 4 | 1 | 1 | 82 | 1 | 1 |
| United States | 5 | 3 | 3 | 111 | 3 | 2 |
| Pakistan | 6 | 10 | 10 | 50 | 22 | 16 |
| Brazil | 7 | 7 | 7 | 113 | 8 | 7 |
| Thailand | 8 | 12 | 12 | 61 | 5 | 3 |
| Russia | 9 | 8 | 8 | 109 | 11 | 12 |
| China | 10 | 2 | 2 | 144 | 6 | 4 |
| Nigeria | 11 | 18 | 18 | 17 | 20 | 17 |
| Turkey | 12 | 9 | 9 | 121 | 19 | 15 |
| Argentina | 13 | 13 | 13 | 26 | 21 | 25 |
| Morocco | 14 | 19 | 19 | 21 | 33 | 18 |
| Colombia | 15 | 23 | 23 | 10 | 27 | 29 |
| Nepal | 16 | 17 | 17 | 19 | 34 | 41 |
| United Kingdom | 17 | 14 | 14 | 71 | 12 | 11 |
| Ecuador | 18 | 37 | 37 | 6 | 45 | 56 |
| Kenya | 19 | 43 | 43 | 5 | 9 | 34 |
| Indonesia | 20 | 16 | 16 | 129 | 18 | 13 |
The graph here shows the ranking of countries based on different rankings of services that give access to the crypto market, thus giving a global look at crypto adoption.
It can be seen that the most popular service is peer-to-peer.
Disclaimer
Our team created a paper synthesising and integrating with other content the concepts expressed in the report 2022 Report Geography of Cryptocurrency